Will Texas power prices continue to hit new heights this summer?
A recent article in the Wall Street Journal [1] poses the question: What might prices look like if it is hot in Texas this summer and the wind doesn’t blow? AFRY’s unique approach to modeling intermittent resources across weather years holds the answer.
The Electric Reliability Council of Texas (ERCOT), the electric grid operator for most of Texas, is forecasting another record for peak electricity demand this summer. Despite the influence of COVID-19, the latest forecast for peak demand this summer is 75.2 [2] GW, an increase of 400MW on 2019, as Texas continues to experience higher demand growth than others part of the country.
In many power markets, including ERCOT, deployments of intermittent renewables such as wind and solar have surged, due to climate change initiatives and rapidly falling costs for these technologies. Since the generation output of these technologies depends on factors outside of the plant operator’s control (e.g., actual wind speed or actual solar irradiation), traditional power market modeling techniques used for fully dispatchable fossil generation do not adequately capture the time varying and stochastic output of renewables. Not all hourly power market modeling is equal. AFRY is continuously breaking new ground modeling intermittent renewables in power systems, helping clients answer questions on weather driven power market operations and assisting in investment decisions [3].
The summer of 2019
Last summer, on August 12th, a new all time peak was set at 74.7 GW with peak hours falling between 2 and 6pm. During this period, the output of ERCOT-based wind was less than 1/3 of its total capacity. Natural gas and emergency demand conservation resources were necessary to meet the peak demand. As a result, price shot up to the $9,000 MWH cap [4].
This summer, once again, the ERCOT is forecasting a reserve margin of less than their own recommended minimum of 13.75%, albeit slightly higher than in 2019, largely due to the addition of new wind and solar capacity. Since weather is variable and weather across Texas is highly correlated, it is not guaranteed that most wind capacity will be available on a hot day to meet demand. Whether temperatures are above or below ‘average’ and whether the wind is blowing or not has a huge impact on prices in the market. [MC1] Weather normal forecasts have difficulty taking this into account. This is where AFRY’s modelling methodology provides an opportunity that others do not.
AFRY Weather Model Approach – Informing the ERCOT Market Outlook
AFRY recently completed the mid-2020 long term market outlook for ERCOT. AFRY uses a unique approach to weather modeling that helps to answer the question of what prices might look like if it is hot in Texas this summer and the wind doesn’t blow.
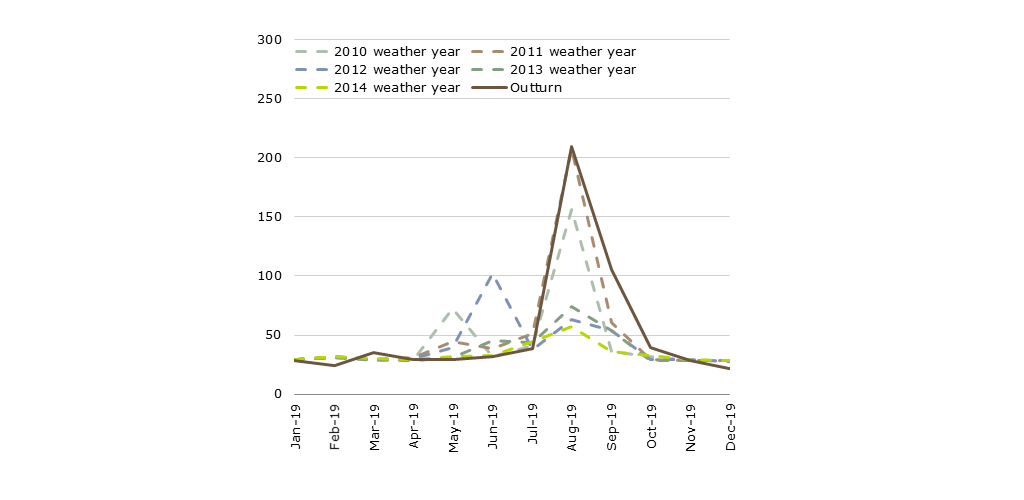
AFRY’s proprietary model, BID3, has extended the existing regional hourly modeling concept to include highly granular weather data as a fundamental input across four categories: wind speed, solar irradiation, precipitation and temperature. Instead of using a normal weather year to model future market fundamentals, AFRY uses actual weather years – in this example the 5 years of 2011 through 2014. As shown in Figure 1, system modelling based on the weather year 2011 was an extremely accurate predictor of monthly prices actually experienced in August 2019.
Figure 1: Mid-2019 Modelled Monthly Peak Prices Vs Outturn (WEST)
$MWh, real 2019 money
[MC2]
What could summer 2020 look like?
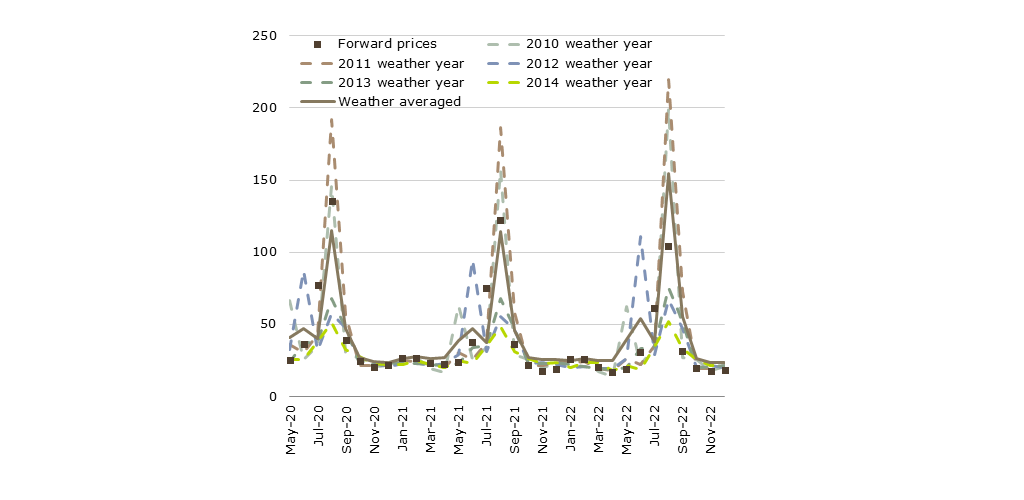
Based on our weather year case collections, AFRY analysis incorporates a range of views of what power prices could be in the near term (2020-2022), and also extending out to 2050. Figure 2 shows our modeled prices compared to the recent near term forward prices.
While the forward market shows a reasonable match to the average of our weather years, it is clear that the modelling approach gives a wide range of plausible market outcomes tied to weather variability. This modelling shows this as both an upside and downside to prices and hence power costs and revenues. If we experience another ‘2011’ type August in the near-term, we could see monthly average prices up towards $200/MWh as in 2019. If we instead experience the cooler and windier weather conditions of 2014 this would lead to prices at less than $50/MWh.
Figure 2: AFRY mid-2020 modelled monthly peak prices vs. forward prices (West)
Implications for market participants
AFRY’s modeling outputs can answer a range of questions important to system operators around what happens in the market when there is variability in the weather, which in turns, impacts both the timing of demand as well as the contribution of intermittent renewable generation resources:
- By how much can the actual output of a renewables fleet differ from expected output as renewable penetration increases?
- How much backup generation is required to maintain reliability in tightest hours?
- Will a rising volume of weather driven renewable generation in power markets lead to major issues with energy surpluses and shortages?
While system operators have a number of, albeit imperfect, tools to address these issues, the implications are just as important for renewable investors. These tend to be severely under-represented by existing market and financial modelling approaches, because the expected revenue of a renewable energy project can be materially different to the revenue under “expected” weather conditions.
This problem is exacerbated in markets where many renewable projects are built in the same area. This divergence between “expected revenue under uncertain weather conditions” and “expected revenue under average weather conditions” grows, as localised renewable penetration increases – when your solar farm is at maximum output, the solar farms of your closest competitors may also be at maximum output, depressing prices for everyone.
Modeling without granular weather assumptions or under only one set of weather conditions is thus a recipe for systematically over- or under -forecasting prices, revenues, and system margins. Depending on the financing approach is will also impact the performance of hedges, your off-take arrangements and project debt service cover ratios.
Our modelling backs up the concerns of the system operator and consumers in Texas reflected in the question posed by the Wall Street Journal – hot weather and a simultaneous reduced output from wind generators could cause an uncomfortable summer. However for power producers in ERCOT the concerns are reversed – a summer (or worse multiple summers) of cooler than expected weather combined with high wind output could be a much more concerning scenario.
Footnotes:
[1] The Wall Street Journal, “Electricity Is Looking Hot, Hot, Hot in Texas,” June 15,2020.
[2] ERCOT final Seasonal Assessment of Resource Adequacy (SARA) for summer 2020
[3] For a more expanded discussion of this topic, see the AFRY White Paper, “Weather Matters,” July 2019.
[4] ERCOT’s $9,000 price cap is the highest such cap in the nation. The System Wide Offer Cap stood at $1,000/MWh during the early years of deregulation, in 2012 it increased to $3,000, to $5,000 in 2013, to $7,000 in 2014 and finally to $9,000 in June of 2015.