A new landscape for DGPV investment in China: Thriving amidst changing time-of-use electricity tariffs
Recently, Time-of-use (TOU) tariffs have gained increased attention after the release of newly updated regulations in several Chinese provinces such as Shandong and Hubei.
The adjustment of TOU pricing has resulted in lower realised prices for solar generation, as periods of high solar PV generation during daylight hours have been reclassified as valley or deep valley time windows in some provinces. This poses challenges to the distributed generation photovoltaic (DGPV) business in particular, as the majority of its power generation is sold under the onsite PPA contractual arrangement, where energy users’ tariffs are linked to this regulated price.
TOU tariffs hold significant implications as a policy lever that directly impacts renewable investment economics and energy user behaviour. The evolution of TOU aims to better reflect the increased generation of renewable energy and spot market signals to enable load shifting. For DGPV investors seeking to optimise long-term revenues and mitigate risks, and power users aiming to reduce electricity costs, amidst ongoing electricity market reforms, key questions remain:
- What is a TOU tariff and how has the pricing mechanism evolved?
- What has been driving TOU tariff mechanism updates in recent years?
- What are the opportunities and challenges for market players such as DGPV investors and power users under the TOU regulatory changes?
Time-of-use tariffs have a long history in China
The TOU tariff is an electricity pricing mechanism that sets different prices (TOU index) for different time windows based on variations in power supply and demand across times of day and the marginal cost of electricity during each period. It aims to guide power users to shift loads through economic incentives, ensuring the stability of the power system. The TOU tariff in China includes peak-valley pricing and seasonal pricing mechanisms. Peak-valley pricing divides each day into peak, shoulder, and off-peak time windows (some provinces also set critical peak and deep valley time windows), while seasonal pricing adjusts time windows by seasonal load variations.
China first introduced pilot peak-valley pricing in the 1980s, and then introduced seasonal pricing in the 1990s in areas with large hydropower production to differentiate prices between wet and dry seasons. Then, the government issued notices in 2003 1 and 2021 2 to further develop TOU tariffs and leverage price signals to support renewable energy consumption.
The drivers of recent TOU regulatory updates
In recent years, rising renewable capacity and new load types like EVs and appliances have significantly altered power supply and consumption patterns. The traditional peak-valley time windows solely considered load patterns but may not fully reflect the changing generation landscape.
From the generation side, intermittent renewables are posing challenges to system balancing. Notably, solar has distinct diurnal characteristics, generating during the day but with zero output at night. Noon was designated a peak period in the past. If this delineation is not changed in provinces with high solar penetration, it could result in mismatched peak-valley delineation between the generation and load. From the demand side, the initial TOU mechanism did not account for the deployment of emerging technologies such as electric vehicles (EVs) and energy storage. Previous peak-valley price differences were too small to incentivise load shifts.
TOU policies have been constantly adjusted in recent years to address the aforementioned challenges. TOU tariffs have evolved from solely considering load pattern to accounting for generation, load and overall power system balancing. Specifically, the consideration of net load (total demand minus wind and solar generation) rather than gross load for TOU window delineation has been adopted in some provinces. For example, Hubei, Zhejiang and Shandong have changed some periods at noon from shoulder/peak to valley or deep-valley. Moreover, the price differential between peak and valley periods has been expanding steadily, with most provinces now setting the differential at 3-4 times of shoulder price.
Driven by the development of spot markets, TOU pricing has started dynamic adjustments, leveraging real-time price signals to adjust TOU windows and indices. Spot markets can better reflect real-time supply-demand, determining value of electricity value in different period. Provinces operating spot markets normally lead dynamic TOU adjustments.
Case Study
As one of China's first batch spot market pilots, Shandong has continually adjusted its TOU windows and indices since 2019 based on spot market price signals. The first adjustment in late 2020 changed noon (12:00-13:00) from shoulder to valley period. Further adjustments followed in 2022, 2023 and 2024, as illustrated in Figure 1.
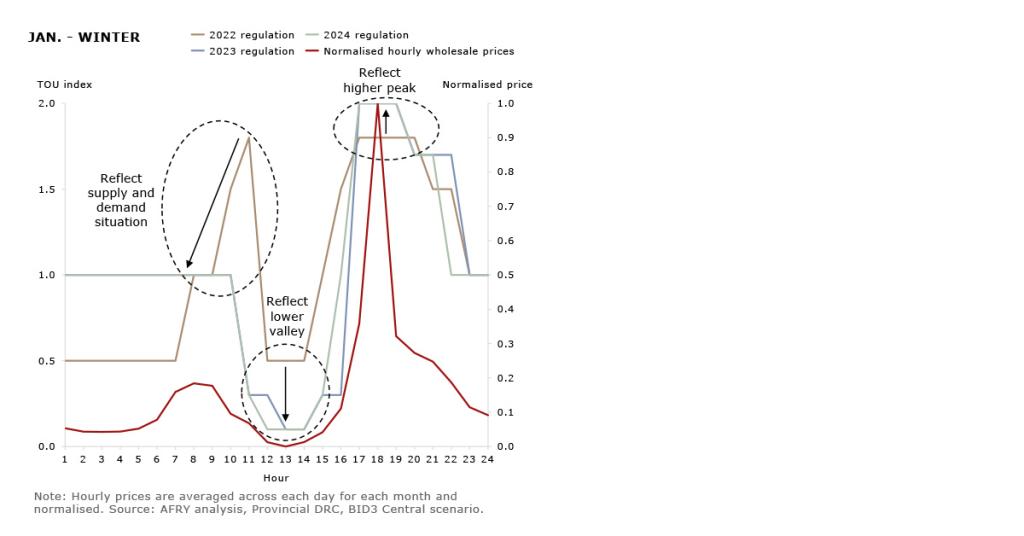
Figure 1. Comparison between Shandong's TOU adjustments and AFRY's projected hourly electricity prices (January as an example).
With the rapid growth of solar capacity in Shandong, which now ranks as the top in China with over 56 GW as of the end of 2023 3 , its generation curve is creating a bigger impact on hourly dynamics especially when it ramps up or down. There is widening peak-valley differences, with a price differential between critical peak and deep valley periods reached 20 times.
Shandong's dynamic TOU adjustments have added uncertainty for market participants. TOU regulatory updates are expected to continue in the future, posing growing price risks for participants. How should investors and power users evaluate these price risks stemming from changing TOU regulations? At AFRY, we use our independently developed BID3 power market optimisation model to simulate hourly dispatch of power stations, market prices, and all other important features of power markets. The hourly wholesale prices demonstrated in Figure 1 closely resemble Shandong's recent TOU regulatory update. For example, there is a deeper valley at noon and higher peak at dust. By further combining other modelling outputs, such as hourly solar generation and demand curves (Figure 2), we can gain additional insights into the future TOU adjustments. Our model can help predict future price trends, providing market fundamentals to mitigate risks and inform long-term investment strategy planning.
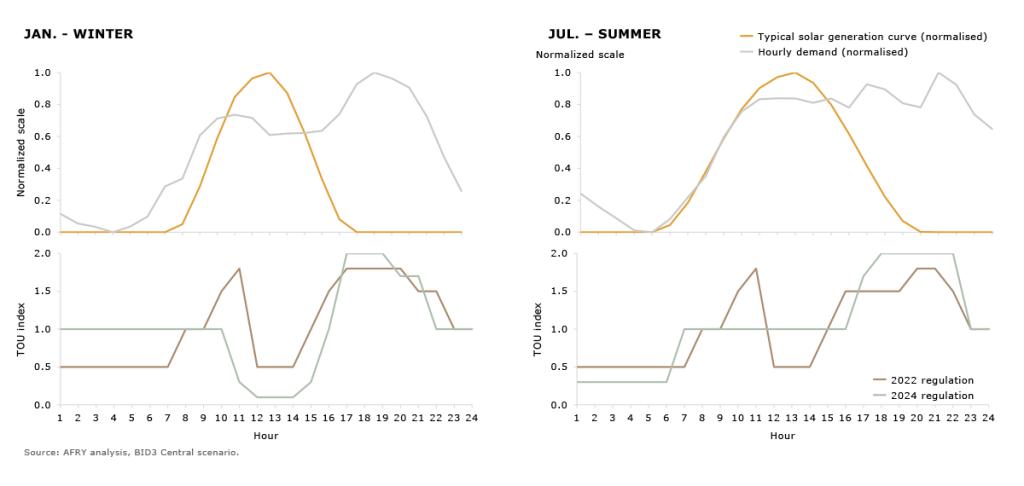
Figure 2. Hourly solar generation and demand curves in Shandong modelled by AFRY BID3 (January and July).
Challenges and opportunities for DGPV investors and power users
Shandong's TOU adjustments designate solar generation peaks as valley or even deep valley periods, which could have a material impact on DGPV project revenues and potentially extend investment payback period. As China's power market reforms progress with the development of a spot market, other provinces will follow similar trends to Shandong. Market participants will be exposed to fluctuating retail tariffs and increased market risks. Timely adjustment of investment and operations strategies thus become imperative in response to rising price swings.
For DGPV investors with existing assets, understanding retail tariff outlook and price risks is key, along with asset optimisation. Market screening for future investment opportunities is also important.
- When assessing tariff outlook and price risks, investors should take into account various market factors and regulatory changes that impact the revenue realised.
- To optimise long-term revenue and mitigate risks, investors need to consider more diversified routes-to-market. For example, aggregating DGPV portfolios to participate in green electricity trading or installing battery energy storage to boost revenues.
- A systemic market screening across China is recommended to identify the attractive markets for future investments.
Energy users could leverage widened peak-valley price differentials to optimise energy usage for cost savings, such as considering energy storage solutions as an alternative risk mitigation measure.
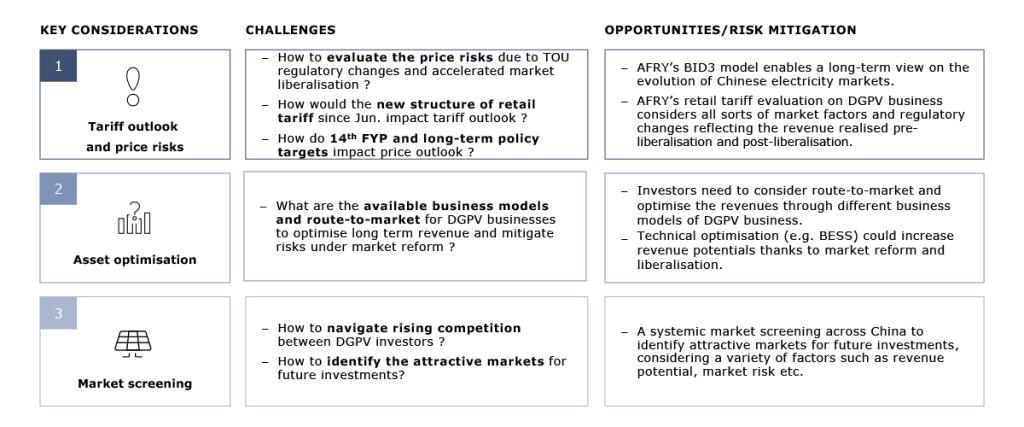
Figure 3: Key considerations, opportunities, and risk mitigation for DGPV investors.
While TOU regulatory updates matter, market participants are now needing to develop power market competence to understand supply-demand driven market fundamentals against the market liberalisation backdrop. Anticipating growing market exposure, DGPV and power users should proactively mitigate risks while seizing opportunities to boost profits and reduce costs.
AFRY's power market dispatch model - AFRY BID3
Since 2018, AFRY has provided power market projections to power generators, investors, financial institutions and more, covering state-owned enterprises, foreign companies and private sector clients. Our model covers 31 provincial-level markets in China, providing hourly economic dispatch and optimisation out to 2060. AFRY's BID3 model is widely recognised in the industry, offering clients "independent, bankable and recognised” projections.
BID3 is an economic dispatch model that simulates the hourly generation of all power stations on the system, taking into account fuel prices and operational constraints such as the cost of starting a plant. It models renewable sources of generation such as hydro, reflecting the option value of water, and intermittent sources of generation, such as wind and solar using detailed and consistent historical wind speed and solar radiation.
AFRY's China team and global team jointly prepare comprehensive inputs and update the BID3 model for China's power market on an annual basis. Inputs for BID3 include: power supply covering all existing plants, and plants under construction and planning, electricity demand, weather data, interconnectors, fuel and commodity prices, and so on. BID3’s outputs provide unique insights into the evolution of future provincial and national markets, as well as the performance of individual assets, including installed capacity, generation, wholesale prices, and power import/export volumes.
Please visit here for more information about BID3.
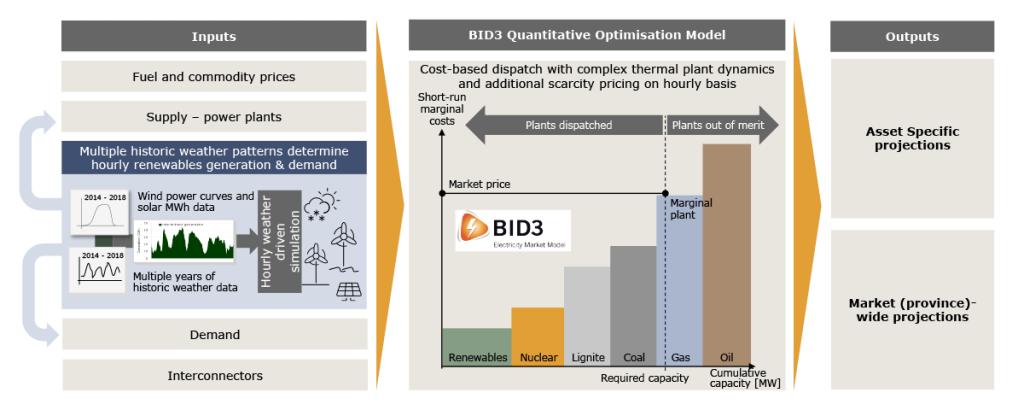
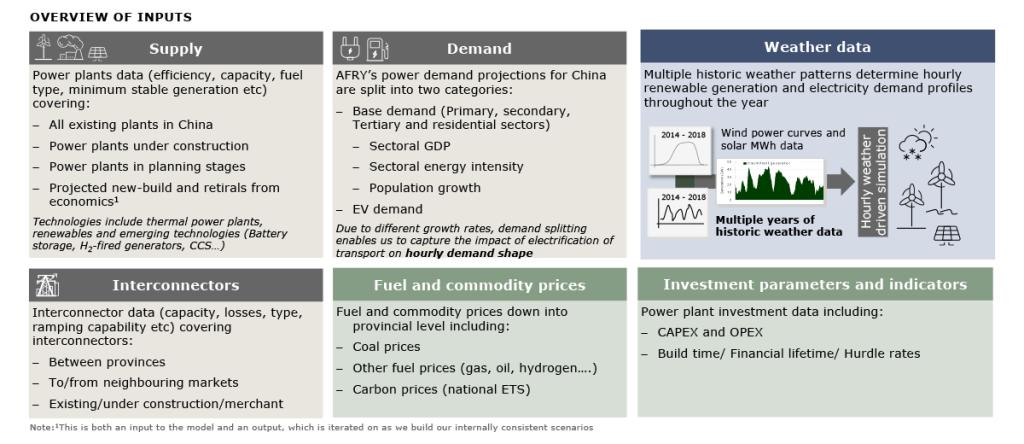
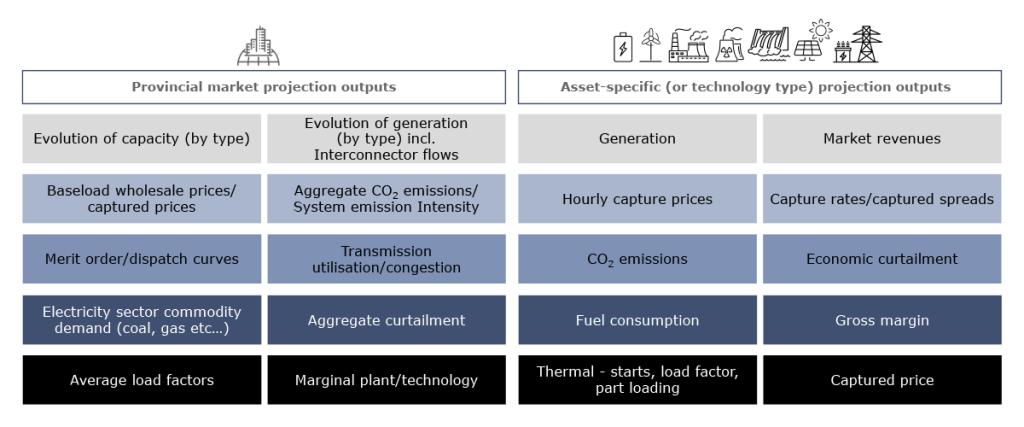
Figure 4. BID3 model.


