Sizing hydrogen storage for green ammonia
Due to the inherent nature of the renewable power, sizing eSyngas plants powered with renewable energy brings complexity normally not faced by natural gas-based facilities.
In this article, Dr Raimon Marin and Dr Solomos Georgiou of AFRY discuss the application of AFRY's state-of-the-art modelling tool to optimise the size and production of a green hydrogen system and a green ammonia plant based on given renewable power profiles and their associated variability (e.g. hourly, daily, seasonally, and annually).
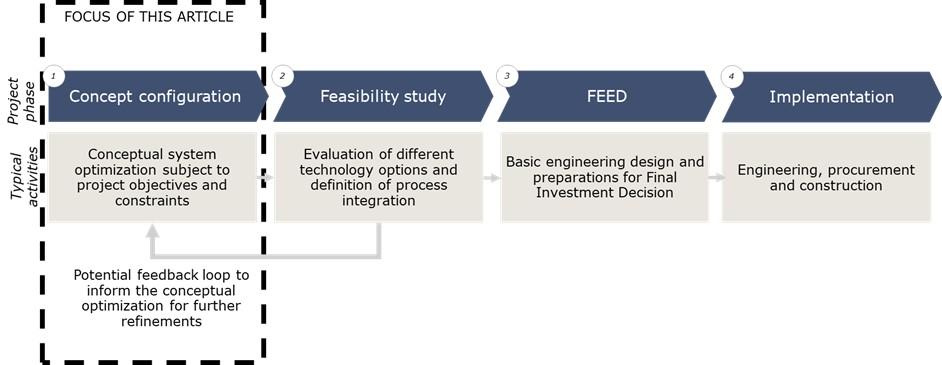
Dimensioning power-to-X syngas plants (eSyngas), utilised in the producuction of e-methanol or e-ammonia (i.e., ammonia synthesised from green hydrogen), and powered with renewables (RES) comes with a level of complexity not seen in natural gas fed syngas plants. For example, an off-grid eSyngas plant cannot run at a fixed rate around the clock in the same way as natural gas fed facilities do. Instead, they’ are subject to the variations (e.g hourly, daily, seasonal and annual) imposed by RES. This variability needs to be considered during the sizing of main plant components including RES (considering both solar and wind where appropriate), access to grid (considering any relevant constraints), electrolysers, hydrogen storage, battery storage and a syngas production unit. This creates an optimization problem that needs to be addressed during the early phases of the project, namely during the conceptual and/or feasibility study. This may need some refinement during later phases of the process, as shown in Figure 1. Utilising its wide expertise, AFRY offers a project lifecycle solution as a one-stop shop for clients developing power-to-X projects, from early-phase concept configuration to all the way to project implementation.
Electrolytic hydrogen produced with RES (green hydrogen) follows the fluctuations of wind and solar energy, which is a relatively easy match for most of the electrolysers in the market today (PEM and high-pressure alkaline electrolysis). However, syngas plants have less flexibility, and this poses a challenge when coupling them with electrolysers. To overcome this challenge balancing solutions will likely be needed. These solutions can include the following :
- electricity storage with batteries
- improved dynamics of syngas plants
- use of hydrogen storage and/or
- access to green electricity via power purchase agreements (PPA)
Typically, utilising batteries as electricity storage is a capital-intensive solution which is mostly viable for short duration storage back up. World leading syngas licensors are currently developing ammonia and methanol technologies, which are able to adapt to the variability of renewables 1 . However, even in situations where large facilities can be operated at very low turndown ratios, (e.g. low turn-down ratio 10%), with production rate variations in the range of %/min, some hydrogen storage solution may still be desirable to smooth out the operations of the facility.
Bulk hydrogen storing can be done either in liquid or gaseous state. Liquid hydrogen storage has been realised at large scale 2 . However, it is an energy intense approach which uses up to 30% of the hydrogen stored as energy input, therefore coming with a very high cost. Gaseous state storage has been engineered and deployed to some significant sizes 3 4 . While storing hydrogen in its gaseous state is less costly than storing it in liquid state, sizing and optimising the gaseous state storage to secure smooth and steady plant operation is paramount for the techno-economic soundness of any project.
AFRY has developed a proprietary model that can be used to optimise the size of the storage, the other key components in a hydrogen production system (e.g., solar, wind, electrolyser, access to grid where relevant) and subsequently the syngas plant capacity. But how can this model can be used in practise to successfully size and optimise a hydrogen production system relying on a renewable energy profile and the capacity of an e-syngas facility?
Model description
AFRY’s proprietary model helps to achieve an optimised system setup and performs various assessments at a plant/project level. The model is based on a cost optimisation challenge with an ability to optimally size and dispatch electrolytic hydrogen production systems. It is able to optimise the lowest levelised cost of production of hydrogen (LCOH) or the lowest "missing money". It is also able to utilise high resolution data (e.g., hourly), spanning over the lifetime of the system and takes advantage of AFRY’s state-of-the art power market projections for reliable power cost/revenue stream potential when there is access to the power market.
The model incorporates both technical and financial characteristics of the project in its optimisation. It ensures that demand is not only met but also that it is carried out in the most financially efficient way. As renewable resource availability can vary within a year as well as across years, AFRY’s model has been developed to capture the weather variability/risk and optimise based on different weather patterns; both in terms of ensuring security of hydrogen supply and sizing the system cost-optimally.
The versatility of the model allows the impact of numerous aspects such as location, demand constraints, access to grid, costs, available revenue streams, policies such as temporal correlation, power purchased agreements (PPAs) and more to be assessed. Different project configurations can be modelled including, for example, off-grid systems with co-located RES, grid connected systems with renewable power through PPAs, grid connected systems with access to the power market as well as systems predominantly utilising otherwise curtailed renewable power.
Additionally, as the model is targeted at optimising the system at plant level, some of the system components can be defined when they are known or fixed. Constraints that serve to limit the capacity of some components can also be enforced when needed. In this way, the system can be optimised in terms of both sizing and dispatch subject to any project specific parameters and/or constraints.
In terms of outputs yielded by the model, we can obtain both physical and financial outputs. Both of these output categories can then be obtained at different temporal resolutions, spanning from a system’s lifetime down to even hourly variations depending on the output and/or the user’s preference. Typical physical outputs include, for example, optimal capacities of components, hydrogen offtake demand (or green ammonia demand), hydrogen production, hydrogen storage level, injections and withdrawals from hydrogen storage, battery level, battery flows, power exports to the grid, power imports from the grid, and more. Common financial outputs include LCOH and its breakdown into the different cost elements, annual cash flows, missing money, revenues from power sales to grid, and more.
AFRY analysed three case studies to illustrate the capabilities of AFRY’s model. These case studies utilise different approaches to meet the same annual ammonia production target whilst also overcoming the same challenge: sizing an off-grid hydrogen production plant and ammonia plant for the given RES profile. For simplification, the LCOH has been taken as a proxy for the ammonia production cost, as it is highly likely for LCOH to be the main contributor to the green ammonia production cost. Note that for simplicity, any power required by the ammonia plant is not considered as part of these case studies and is assumed to be sourced independently. For these case studies, the RES representing the Netherlands are used to show the relative differences between all the results; therefore all results presented have been normalised.

Case study 1: Flat profile demand
This case study assessed the hydrogen storage size for the selected renewable profile, with no power curtailment for an assumed 50/50 split between solar and wind, and with ammonia plant operation and a flat 100% throughput, similar to how traditional syngas facilities would operate around the year.
Case study 2: Asset optimisation for a flat profile demand
In this case study, the renewable capacity (wind and solar) is optimized along with the electrolyser capacity and hydrogen storage for a set annual ammonia production with a non-flexible hydrogen demand. In other words, the hydrogen production plant is optimised to ensure a steady supply of hydrogen, which the ammonia plant needs to operate rigidly as its desired capacity.
Case study 3: System optimisation - assets and hydrogen demand
In this case study, a holistic approach was taken to optimise the plant’s overall operations, including renewable capacity (wind and solar), electrolyser capacity, hydrogen storage and green ammonia’s annual production with semi-flexible hydrogen demand; thus, assuming that ammonia can be produced semi-flexibly. In this case, the renewable energy supply, electrolyser capacity and hydrogen storage must adapt to the turndown ratio set for the ammonia facility, which is set at 40%. The frequency at which the plant rate is changed to adapt to the RES available was also set to three days. This means that when the operators change the plant throughput it will remain at the same level over the course of three days before a throughput modification is allowed again even in situations where the hydrogen production goes below 40% of its nominal capacity due to the lack of RES. Should this happen, hydrogen from the storage is withdrawn to sustain ammonia production. The three-day constraint is arbitrary and can be modified. The operator of the facility must define the operational philosophy for each particular project.
Comments and discussion
Figure 2 summarises the three case studies considered and their corresponding optimal configurations. The icons in figure 2, from left to right, represent renewables, electrolysers, hydrogen storage and ammonia production site, while the size of the icons is indicative of the relative capacity between the cases. As can be seen, optimising both capacities and ammonia production can result in a significantly different project setup. The most significant benefits can be observed when comparing the non-optimised case 1 to any of the other two cases. Nevertheless, all hydrogen supply system components can potentially be downsized by adding some flexibility to hydrogen offtake and optimising the ammonia capacity and production profile.
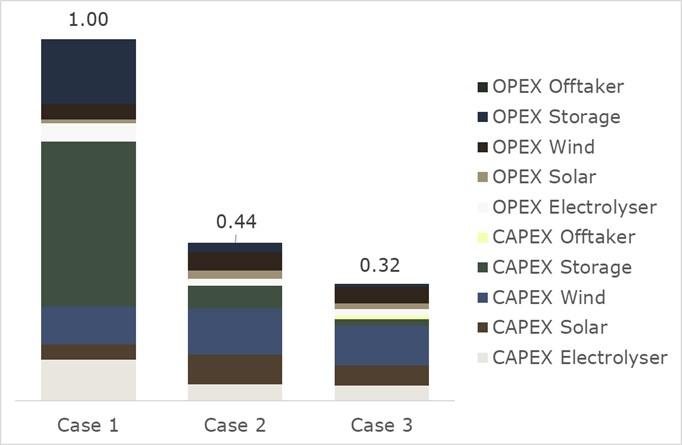
The next step is to observe the contribution that capex and opex have on the ammonia factored LCOH, including key components of a renewable hydrogen production plant and any additional fixed costs associated with the oversizing of the green ammonia facility over the baseline capacity, where that is relevant. Figure 3 shows that in case 1 (non-optimised scenario), storage costs largely overtake any other cost. By optimising the facility, like in cases 2 and 3, the storage contribution is reduced to a marginal contribution to the overall ammonia factored LCOH. For cases 2 and 3 renewables serve as the main contributors to the LCOH. In case 3, optimising the ammonia production reduces LCOH by more than 25% compared to case 2, with all the common components between the two cases showing a decrease. It is worth noticing that the overall LCOH drop in case 3 is achieved despite the additional fixed costs associated with the larger ammonia plant. This shows how having the appropriate conceptual design for a plant at the early stages of a project delivers a competitive and sound techno-economical approach to deploying a green ammonia facility.
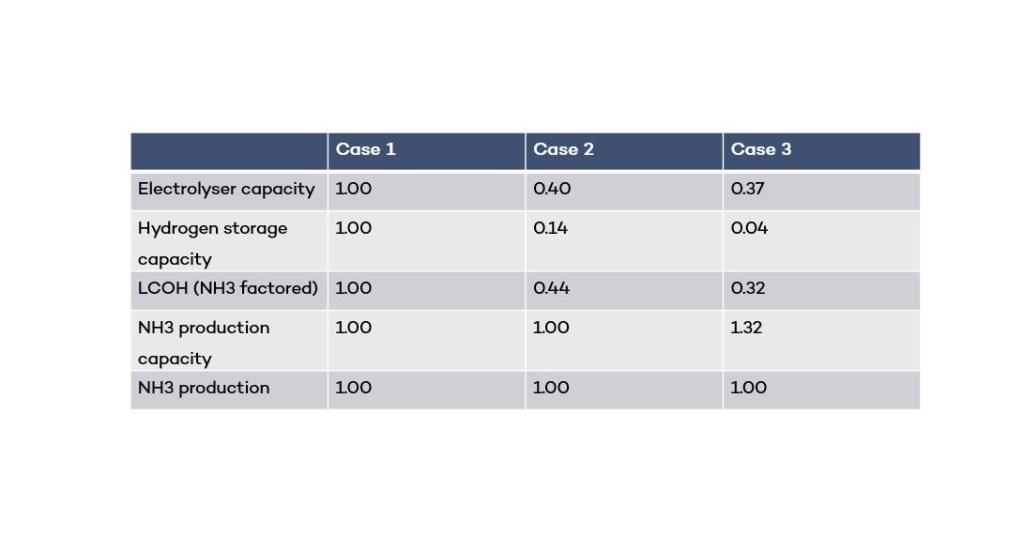
Table 1 compares the electrolyser, storage capacities and ammonia production between the different case studies. The electrolyser capacity, a key capex syngas plant driver, is largely reduced in cases 2 and 3. However, small differences between the last two cases are seen in the form of optimised electrolyser capacity. The significant difference, however, is in the storage size. The holistic approach of optimizing the ammonia production capacity yields a much smaller storage capacity compared to both cases 1 and 2. Not only does this improve the cost of production of the ammonia factored LCOH, it can also facilitate the deployment of the storage, considering that scaling up these facilities can prove difficult.
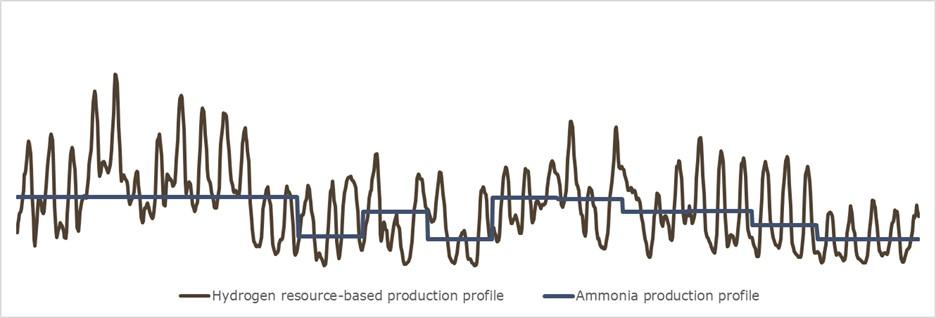
The deployment of the hydrogen storage facilitates the smooth operation of the green ammonia plant within the operational constrains. In case 3, the plant is oversized by about 30% to meet the annual production of ammonia. This means that for a targeted annual production of 100 ktpa, the nameplate capacity of the ammonia plant would be 130 ktpa. Note that currently, and probably for the foreseeable future, the capex of green hydrogen production systems will remain relatively higher than those for ammonia synthesis plants. Hence, oversizing the later with respect to the former could make sense, depending of course on other factors such as the cost of hydrogen storage and RES generation profiles. Furthermore, oversizing the ammonia capacity allows the operator to take advantage of favourable weather conditions to produce surplus ammonia, providing the supply chain is able to cope with temporal ammonia overproduction. To illustrate this, Figure 4 shows a sample snapshot of the hydrogen resource-based production profile and the ammonia production profile for case study 3.
Grid-connected hydrogen production plants
Grid-connected hydrogen production plants can be built in areas where the infrastructure allows it. In such cases, green PPAs could be used to secure renewable energy to produce green hydrogen and thereafter ammonia. In case of grid-connected plants, bulk hydrogen storage is likely to be needed depending on the PPA energy volumes and temporal correlations requirements, such as the e-ammonia plant’s capacity to operate in hot idling mode. AFRY’s model also incorporates features to consider PPAs to size the overall complex in a similar way described in the previous case studies. In such cases, PPA prices can be varied on a yearly basis, as well as within the year if a profile is applied.
Temporal correlation requirements
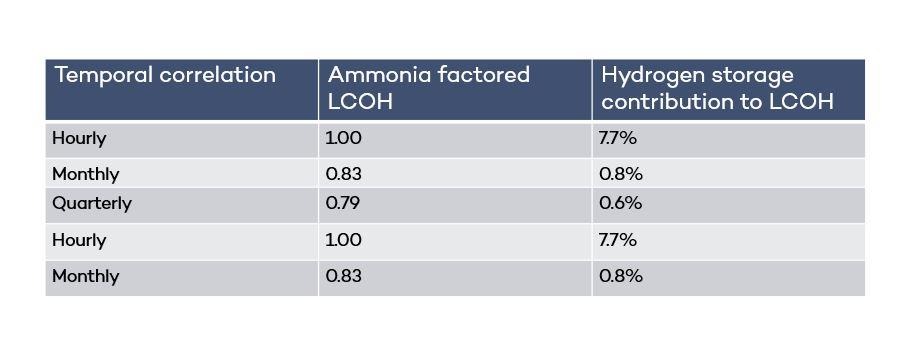
Temporal correlation, in this case the correlation between renewable energy production and consumption, is a legal imperative for labelling hydrogen as green in some regions such the EU. At the time of writing, it is still unclear what the temporal correlation requirements will be for green hydrogen. This represents a possible source of uncertainty for stakeholders interested in the deployment of green hydrogen production. Although initial EU policies have indicated the possibility for an hourly temporal correlation requirement (i.e. every hour of green hydrogen production should match the hour of renewable generation), it is possible that this requirement could be mitigated (e.g. to a monthly, quarterly or any other time interval). AFRY’s model incorporates this temporal correlation feature, hence allowing the scrutinization of its implications in terms of ammonia factored LCOH. Table 2 illustrates some representative results of the impact of the temporal correlation, which apply to case study 3 outlined previously. As expected, the hourly correlation imposes a very strict scenario that could have a detrimental impact on the cost competitiveness of green ammonia, whereas a more relaxed correlation (e.g., monthly, or quarterly) could significantly improve its cost competitiveness. It is worth mentioning that the values tabulated in Table 2 are highly dependent on the conditions and parameters selected.
Conclusions
Having a holistic approach to the definition of the plant size is critical for the financial success of any Power-to-X project. For any given location, the ideal scenario for sizing the production capacity (i.e., plant capacity) should be taken into consideration for all assets involved, from renewable assets and/or grid connection options to the process operating units (e.g., electrolysers, storage, syngas facility...). Besides the renewable asset (i.e., wind/solar assets), hydrogen storage can play a large role in the capex of the project, hence careful sizing shall be considered.
This article was initially published in Nitrogen+Syngas magazine's issue 381 in January 2023. Read the full magazine here.
Footnotes
- 1. Reference 1: https://stateofgreen.com/en/solutions/reddap-the-worlds-first-dynamic-g… a↩
- 2. Reference 2: https://www.spglobal.com/commodityinsights/en/market-insights/latest-ne… a↩
- 3. Reference 3: https://www.iberdrola.com/press-room/news/detail/storage-tanks-green-hy… a↩
- 4. Reference 4: https://www.hybritdevelopment.se/en/a-fossil-free-development/hydrogen-… a↩


