AFRY Pulse NRG – Energy reduction made effective
Implement energy strategy throughout the organisation
Tailored Solutions for Industry Efficiency
AFRY have tailored a software tool to help industries to optimise and decrease energy consumption in a practical way.
AFRY NRG has built-in experience and functionality tailored to understand when and why energy consumption is abnormal and out of limits. The overall purpose is for everyone to understand how they can contribute to lower energy consumption and work towards targets such as ISO50001.
Empowering users with clear consumption visualisation and target-setting
Functions such as normalisation and energy visualisation help users to clearly see consumption and compare consumption to a different season or production setup. A standardised way of working helps users understand actions and execute actions step by step on a daily basis to reach an overall target. Setting targets and visualising the stepwise road is fundamental in AFRY NRG.
Unleashing Efficiency and Value
- Minimise efforts in data gathering, and maximise value-added: By automating all collection, processing and presentation in one place, the daily need for manual work is minimised while maximising the value of the information.
- Information accessible across the organization: Through an authorisation-controlled, web-based system, the right information is made available to individuals or executives at the right level.
- Make it visual, for everyone, always: Select relevant key figures and visualize them on strategically placed dashboards.
- One source of truth: By collecting and pre-processing all historical data in one place, we ensure that the data is comparable and consistent.
- All relevant information in one place: Energy consumption, aggregated data, key figures and calculations are all made available in one system, which increases reliability and trust in the information.
- Taylor-made to your needs: Screens, key figures and consumer structure are easily configured according to your needs to provide a system adapted to existing organisation.
Scalable solution: Start with a limited area or a limited depth and gradually expand with new measurement points to learn more about the facility's consumers.
Upgrade your energy management system with:
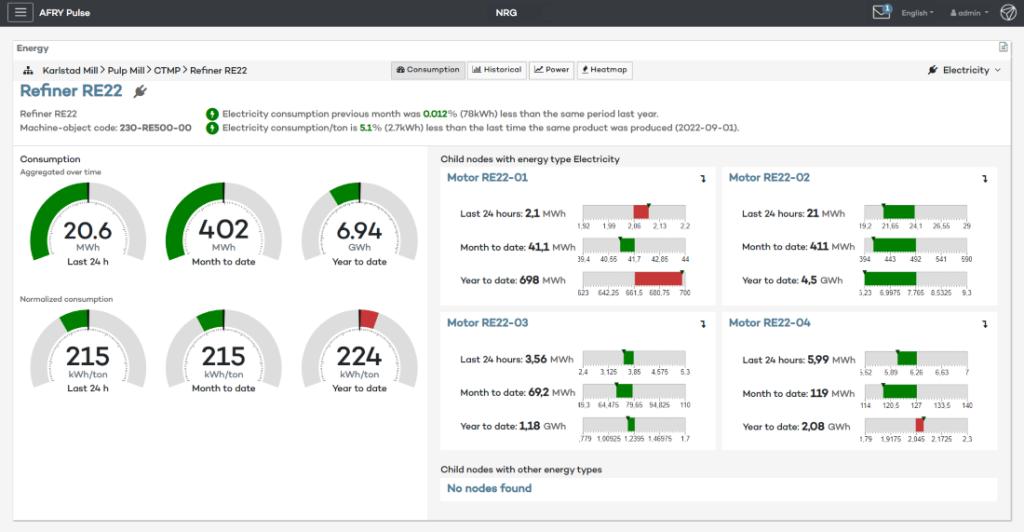
- Instant and long-term consumption overview: The system offers a clear picture of consumption over different time horizons. How does it look right now, last month or last year?
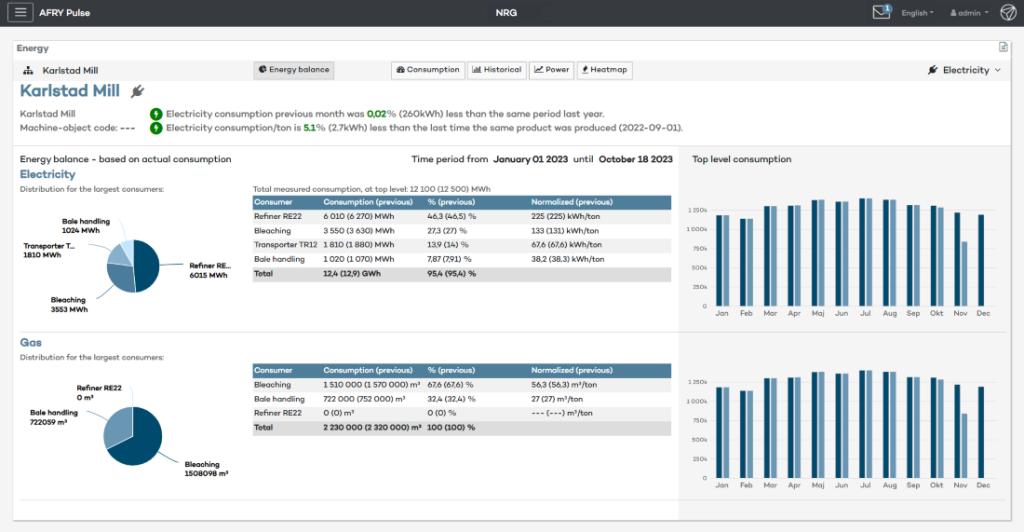
- Normalised consumption to support effective and understandable KPIs, ready to act on: For all energy nodes the consumption is reported. In addition to this, a normalised value can be used to put the consumption in a more relevant context. The calculation can, for example, be based on production rate and/or external factors such as temperature or moisture content.
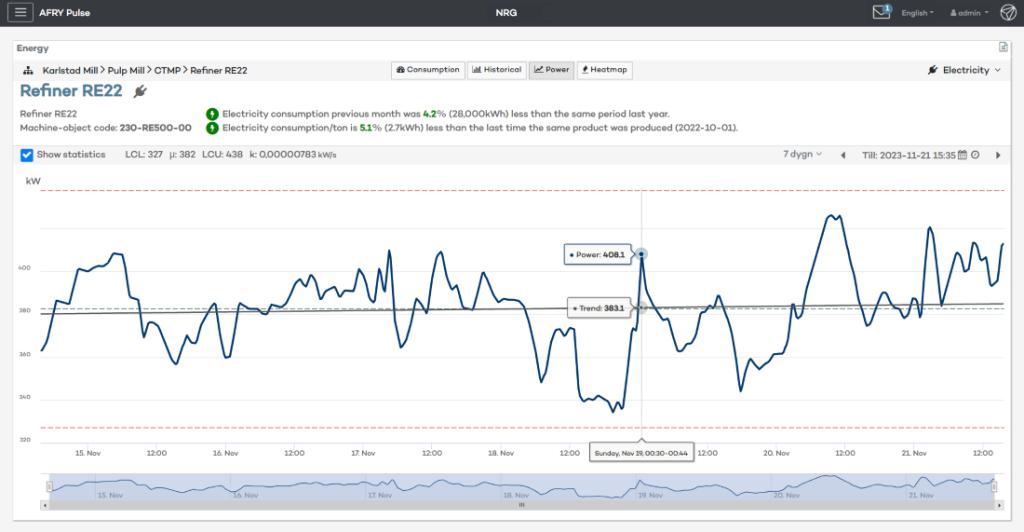
- Historical overview and analytics: Consumption and normalised values can be grouped and filtered to study variations over time from different time perspectives. It is also possible to directly study power consumption for periods of interest.
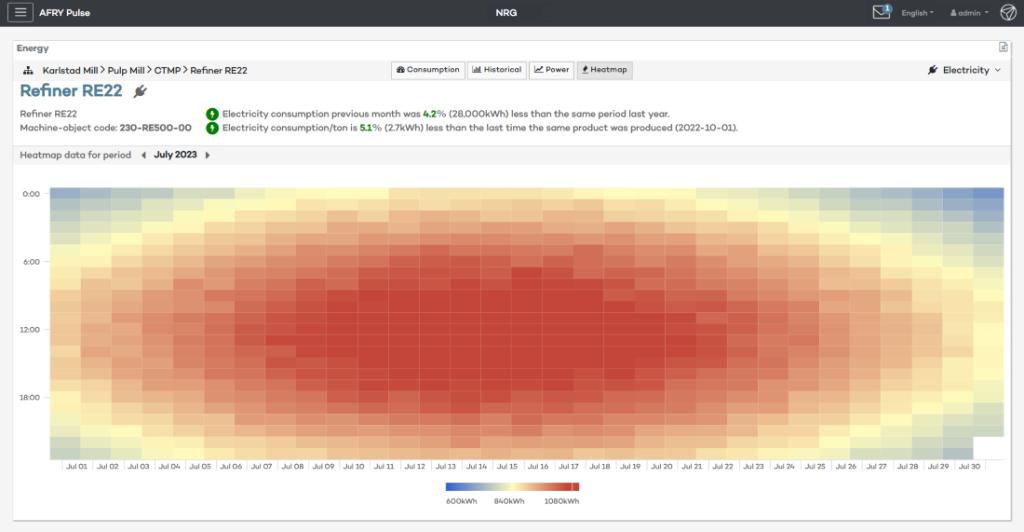
- Heatmaps: This is a tool for illustrating in a graphical, overview way how consumption varies over several time dimensions at the same time.
- Asset tree in multiple layers: All measurement points are placed in a tree structure to clarify how they relate to each other. The structure can be connected to the production organisation or be completely independent. You decide the depth yourself.
- Energy balance at the top level: In the energy balance, you can see how the consumption of the largest consumers compares to each other. The balance is reported separately for all different types of energy, and it is possible to configure which measurement points should be included.
- ISO50001 compliant
How to get started:
You can start your energy optimisation step by step and advance:
- Connect AFRY NRG to data sources and energy meters.
- Define an area of interest, set your limits, and define targets for energy consumption. depending on the situation – normalise readings so they can be compared more easily. Define where to start by pointing out large consumers or suitable equipment.
Ready to start:
- Set up dashboards presenting relevant information to help move to target.
- Set up / define a starting point, by pointing out large consumers or other suitable equipment.
- Regular follow-ups on consumption & actions for continuous improvements.
The Implementation Project:
AFRY NRG is normally installed and up and running after 2 weeks. This is given that it can be connected to a mill database for energy readings, AFRY configures and trains customer superusers in using the tool. AFRY NRG can be installed on-premise or cloud. If required - AFRY can also advise and help with defining a starting point and plan for energy optimisation by setting initial actions and structure.
FAQ
- How can an energy management system help reduce energy costs?
- What types of data does the energy management system collect and analyse?
- How many meters should be installed before the tool is implemented?
- Does the system provide real-time monitoring and reporting of energy consumption?
- How scalable is the system for future expansions or changes?
- Is the system ISO 50001 compliant?
- Is the SCADA system a suitable tool for energy management?
By analysing energy data, organisations can identify inefficient processes or equipment that may be consuming more energy than necessary. This leads to proactive maintenance and early detection of equipment faults and suboptimal performance. Energy usage during peak demand periods reduces reliance on expensive peak-load periods and enables the organisation to participate in demand response programs where available. Raising awareness among employees about energy consumption and making it available throughout the organisation, leads to behavioral changes.
For energy management purposes, information in the form of totalisers is typically captured from existing metering equipment (electricity analyser, volumetric gas meters, steam meters, etc.) and transformed. Pulse NRG allows for the connection to various OT sources, including PLC or SCADA/DCS systems, making all of the relevant process parameters available to be analysed in combination with energy information.
There is no minimum number of metering points required for the tool to provide insightful information on energy consumption. The system gives every metering point a meaning and transforms the provided information into decisions and thus organisations with a low level of monitoring equipment get an immediate value. Measurement gaps in the organisation are detected through energy balancing, supporting, and prioritising the decision for additional monitoring positions.
Yes, the system can capture real-time energy and process information, transforming it into aggregated and KPI values for reporting purposes.
PULSE NRG has been created as a modular application that grows with the organisation's needs. Additionally, other production support modules are available in PULSE, offering a complete suite covering most of the typical production environment needs.
PULSE NRG has been designed to cover the needs of energy management as defined in the ISO 50001 standard and it is aligned with the minimum requirements organisations face. The tool supports energy planning activities, operational control, tracking and verification of opportunities for improvement and communications, while keeping a record of energy performance, monitoring results, and other relevant documentation.
No, SCADA collects data and controls the direct process, but is not suitable for management purposes due to a lack of important functions, easy and accessible data, and overview, data can be presented but it´s difficult to present the needed information.

Interested in our offering? Contact us!
Contact César Nuez

Interested in our offering? Contact us!

